Ain't That Unusual
Market Fear and Loathing In Election Season
It is normal behavior to form opinions regarding future market performance based on our perceptions of presidential candidates (or on any number of other events!). We want to believe that our candidate will be good for the economy and markets and the other candidate will not be (often, we want to see the other candidate’s economic policies fail - which is truly, logically perverse, BTW).
Musical accompaniment today: GooGoo Dolls, Green Day, and Loggins and Messina.
A recent survey (see the entire article here) conducted by Nationwide and The Harris Poll found 32% of investors believe a recession in the U.S. is imminent “if the political party with which they least align gains more power in the 2024 federal elections.” Similarly, 31% believe that their financial future will be negatively affected if the party they least align with gains more power.
The swirl level - the “Fear and Loathing in Las Vegas”, is high. You will read many purported analyses, which I think are more properly called speculations. Your trigger factor is likely to be high. Our brains want to secure and protect our financial futures. You will find something you read, perhaps many things, appealing.
We vote on our beliefs with our feet. During election years we tend to flee the volatility of stocks and move our money into cash/money market funds. The fear of change clearly sends the well-proven fact that time in the market is far more important than timing the market to the showers. “Do not pass Go, do not collect $200”.
My fundamental finding with regard to all forecasts and predictions is this: The Forecasters’ Hall Of Fame has zero members (my current writing on this is here). We want to KNOW that our decision is good, and factual, and the right thing to do. The problem: “Cause all we are is what we’re told, and most of that is lies.” What others tell us, from their own narrative, and what we tell ourselves from ours, can be flawed in any number of ways.
A little bit of mindfulness - stopping for a moment and evaluating what we are feeling, compared to the facts - might help.
Past Elections and Market Results
Year one of a new presidency has shown average S and P performance of 8.3%. There have, of course, been negative years, the worst being -20% or so, and you can see a decent standard deviation in the numbers, so you can expect a fair amount of volatility.
Years two and four are clearly far more volatile. The average year two return is 3.5%. Year two is clearly the year when you should expect a wide potential set of outcomes, and if you wanted to bet against (“go short”, in industry parlance) the market, these would be the years (I am not a short seller, nor do I recommend short strategies to our clients. The “long” data is far too compelling). I will note that your chances of being wrong on a short trade in year two appear to be quite high, as the upside range is larger than the downside. Year four has a wider range of downside, so perhaps a short trade here looks like a decent strategy - but the problem is that 9.1% average return.
Year three is just as clearly the best year to run with the S and P (i.e. “go long”).
The S&P 500’s average return during election years is about the same as non-election years, but it is positive more often. The average return of the S&P 500 in election years was 11.3%, roughly in line with the 11.6% average return in non-election years.
However, election years saw the S&P 500 generate positive returns more frequently than non-election years: 83% of election years (20 of 24) saw positive S&P 500 returns, higher than the 69% (49 of 71) for non-election years.
Recessions matter much more to financial markets than political parties. At first, it appears election years with Republican winners saw markets advance more (15.2% average return) than years with Democrat winners (8.1% average return).
That gap in returns can be almost entirely explained by recessions. By chance, a Democrat was elected during a recession year more often than a Republican (four times vs. two times, respectively). After removing those six election years where recessions occurred, average S&P 500 returns were much more similar for Democrats and Republicans (14.7% vs. 16.0%, respectively). (Read the entire article here)
Let’s look at market performance during election years. When the incumbent party wins, we have seen better years. 87% of the time, when we see consistent declines in September through November, the incumbent party wins. So, at least with respect to your US equity investments, you want to see the incumbent win.
See the full article behind the following charts here.
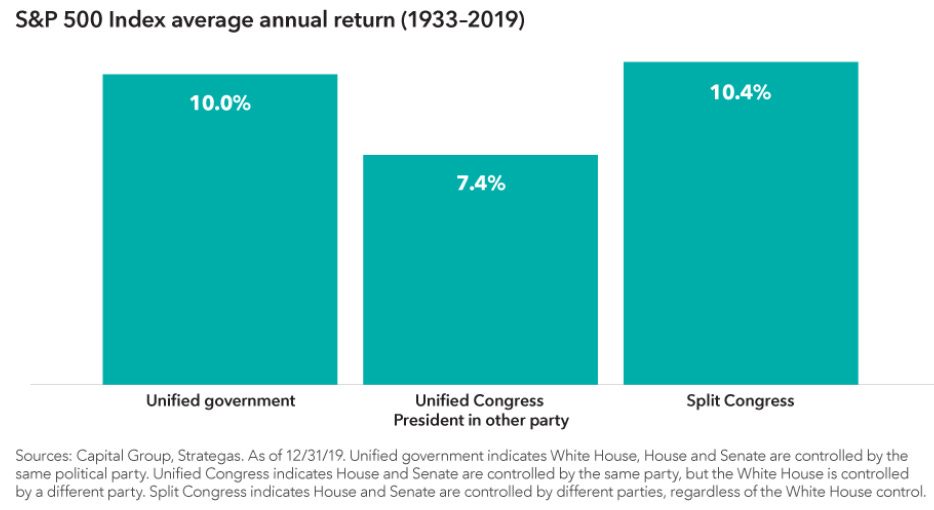
What about this tumultuous, contentious time, where we have so much animosity and partisanship? Guess what? The S and P, at least up to this point, does not care. Will it be different this time? I cannot tell you, nor can anyone else. What I know is that it has not mattered in the past.
Clearly, however, we see lower returns (and yet, positive) when Congress aligned with one party opposite to the President.
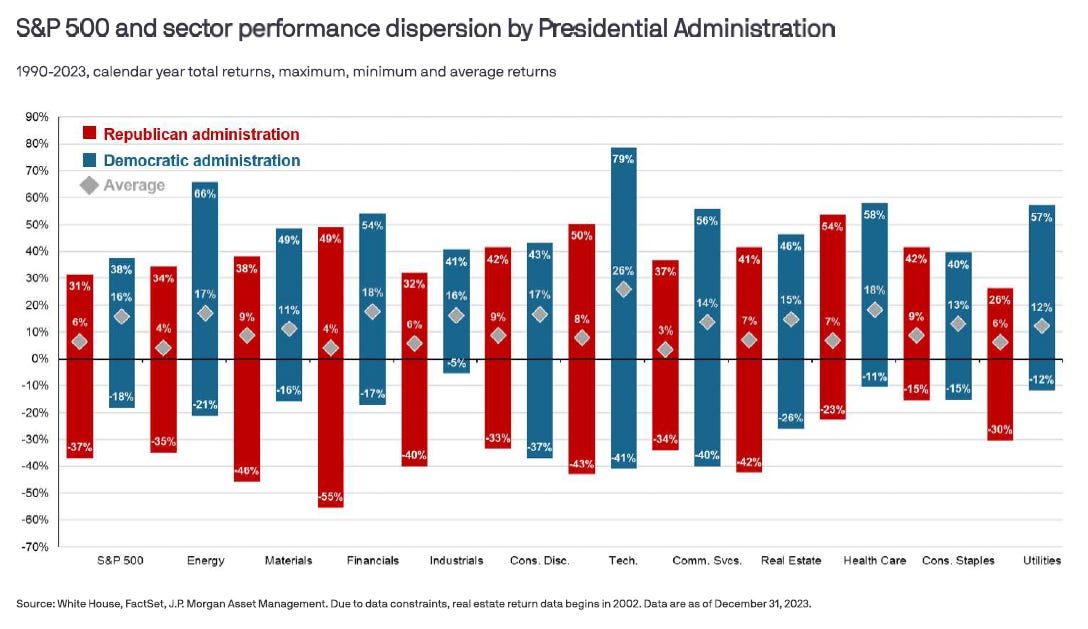
We see, also, regardless of the political messaging you are seeing and what you may believe, the S and P, in every scenario post-Depression, has had positive performance during every party’s tenure in the White House. The worst performance was during the Nixon-Ford Presidencies.
When it comes to which party demonstrates better performance, under Democrats we tend to see both higher performance and wider ranges of performance. The worst markets, in most cases, though, occurred under Republican Presidents. Keep in mind that this only represents 33 years of performance data, so it is not comprehensive.
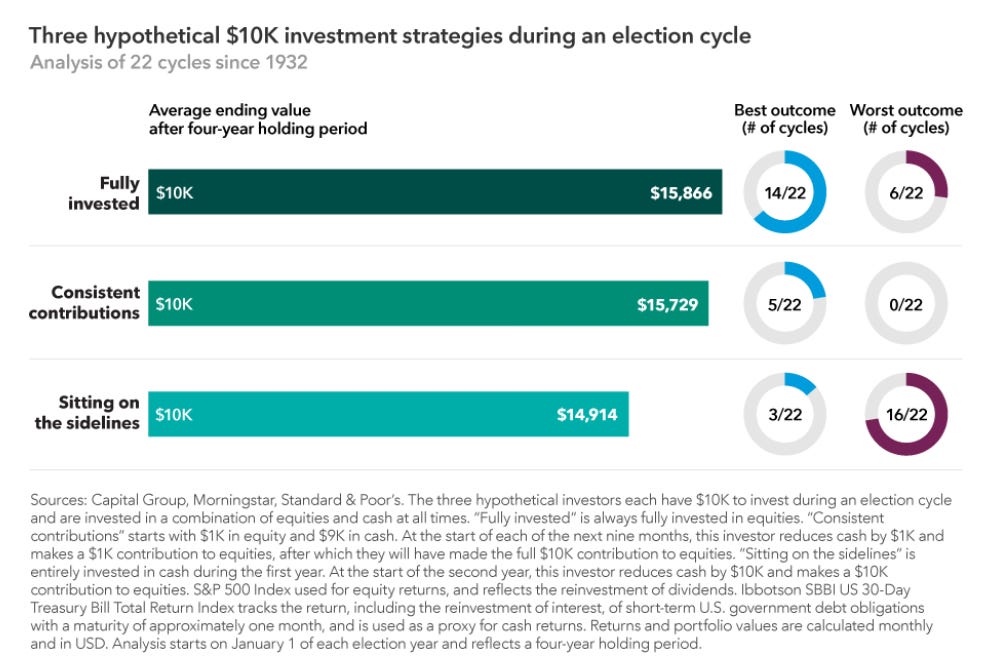
A model of the market timing we obviously engage in during election years demonstrates that this attempt at timing reduces the collective performance of our investment portfolios. It also shows that the most “risky” (in our brains) strategy is the most effective, and therefore least risky in terms of wealth creation. The “conservative”, go to cash strategy has the most performance risk to our portfolio performance. Nervous, and still with some faith and courage? Hedging your bet with systematic, automatic contributions closely approached the performance of staying fully invested.
Overall, election years have historically seen the second lowest market returns of the presidential term cycle, with an average monthly return of 0.54%. However, markets quickly play catch-up after election year uncertainty is resolved, averaging a monthly return of 1.28% during the year after the election. Midterm election years are the weakest point for markets in a presidential term, historically seeing average monthly returns of 0.3% regardless of the party in control of the White House.
As we enter January, we would highlight to investors that the beginning of election years (January-March) historically sees negative market returns as the primary process – and associated political volatility – hits its peak, with average monthly returns of -0.44%.
Source: Raymond James (see the article here)
Market Timing Observations
Fundamentally, when you are trying to set an investment strategy based on the party in power or election cycle, you are engaging in market timing. As noted above, this is a well-proven, ineffective strategy.
No matter how much you believe that a candidate is an American Idiot, and whether you favor Green Day’s recent adaptation of the lyrics or not, your timing is seriously unlikely to work.
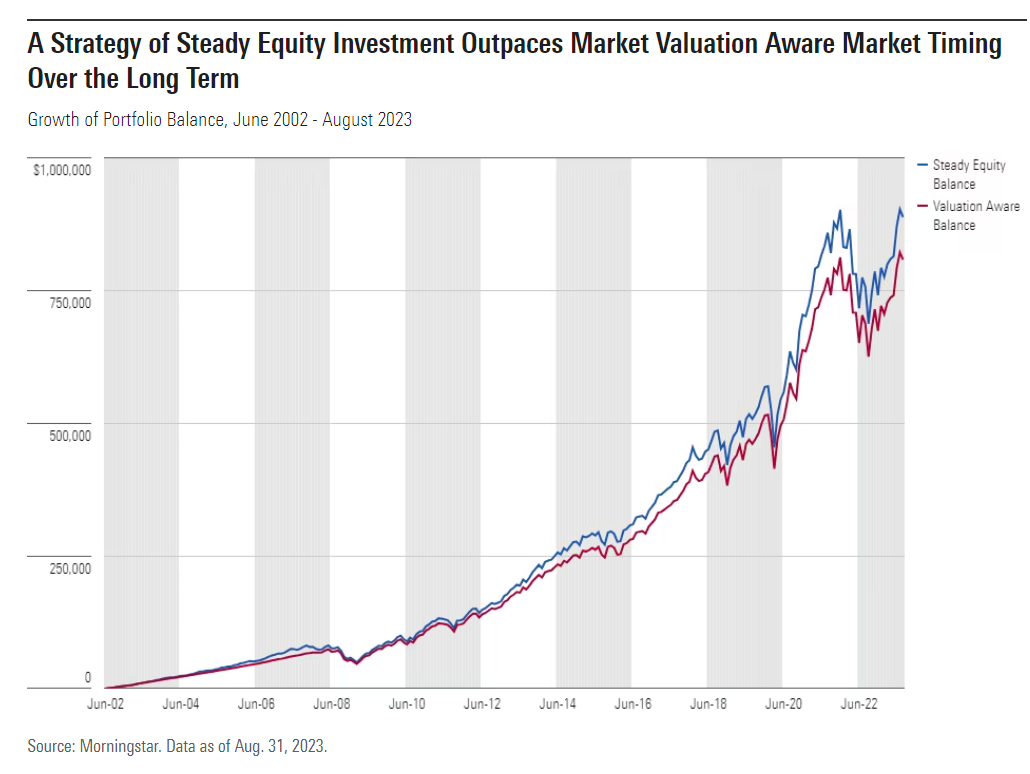
Investing when it appears stocks are undervalued underperforms staying invested regardless of market characteristics.
Here is some Schwab research:
But don't take our word for it. Consider our research on the performance of five hypothetical long-term investors following very different investment strategies. Each received $2,000 at the beginning of every year for the 20 years ending in 2022 and left the money in the stock market, as represented by the S&P 500® Index.2 (While we recommend diversifying your portfolio with a mix of assets appropriate for your goals and risk tolerance, we're focusing on stocks to illustrate the impact of market timing.) Check out how they fared:
Peter Perfect was a perfect market timer. He had incredible skill (or luck) and was able to place his $2,000 into the market every year at the lowest closing point. For example, Peter had $2,000 to invest at the start of 2003. Rather than putting it immediately into the market, he waited and invested on March 11, 2003—that year's lowest closing level for the S&P 500. At the beginning of 2004, Peter received another $2,000. He waited and invested the money on August 12, 2004, the lowest closing level for the market for that year. He continued to time his investments perfectly every year through 2022.
Ashley Action took a simple, consistent approach: Each year, once she received her cash, she invested her $2,000 in the market on the first trading day of the year.
Matthew Monthly divided his annual $2,000 allotment into 12 equal portions, which he invested at the beginning of each month. This strategy is known as dollar-cost averaging. You may already be doing this through regular investments in your 401(k) plan or an Automatic Investment Plan (AIP), which allows you to deposit money into investments like mutual funds on a set timetable.
Rosie Rotten had incredibly poor timing—or perhaps terribly bad luck: She invested her $2,000 each year at the market's peak. For example, Rosie invested her first $2,000 on December 31, 2003—that year's highest closing level for the S&P 500. She received her second $2,000 at the beginning of 2004 and invested it on December 30, 2004, the peak for that year.
Larry Linger left his money in cash investments (using Treasury bills as a proxy) every year and never got around to investing in stocks at all. He was always convinced that lower stock prices—and, therefore, better opportunities to invest his money—were just around the corner.
Investment Strategy In Election Years
What all of this tells me:
We serve ourselves best by acknowledging our emotions and at the same time detaching ourselves from said emotions and sticking with the current strategy.
If you are holding cash, the least risky strategy is to invest it.
Lump sum investing is the most effective.
Systematic investing (“dollar-cost averaging” is the industry term) is nearly equally effective and tends to be emotionally more comfortable.
The candidates and/or Presidents have had minimal effect on the long-term performance of the markets.
Democratic regimes have produced the best investment results.
Thanks for reading. Let me know how I can make this better for you.
Sundry
I finished “The Fund” this week. This book highlights a number of behavioral finance themes and issues, although perhaps somewhat unintentionally. But, like cockroaches, they are everywhere.
I do my best to not take sides or allow in my own biases in these conversations. I hope I do this reasonably well.
Most moving song this week:


